Dashboard

Tiles you arrange yourself: every figure against its plan, scoped to a grant, a person or a year.

  • Transparent
  • In control
  • Flexible
  • Easy to use

What you get

  • Your tilesPick them, size them, order them.
  • Against the planSpent against time, effort against plan, days against the ceiling.
  • One line eachUnder every chart, what the figure means.
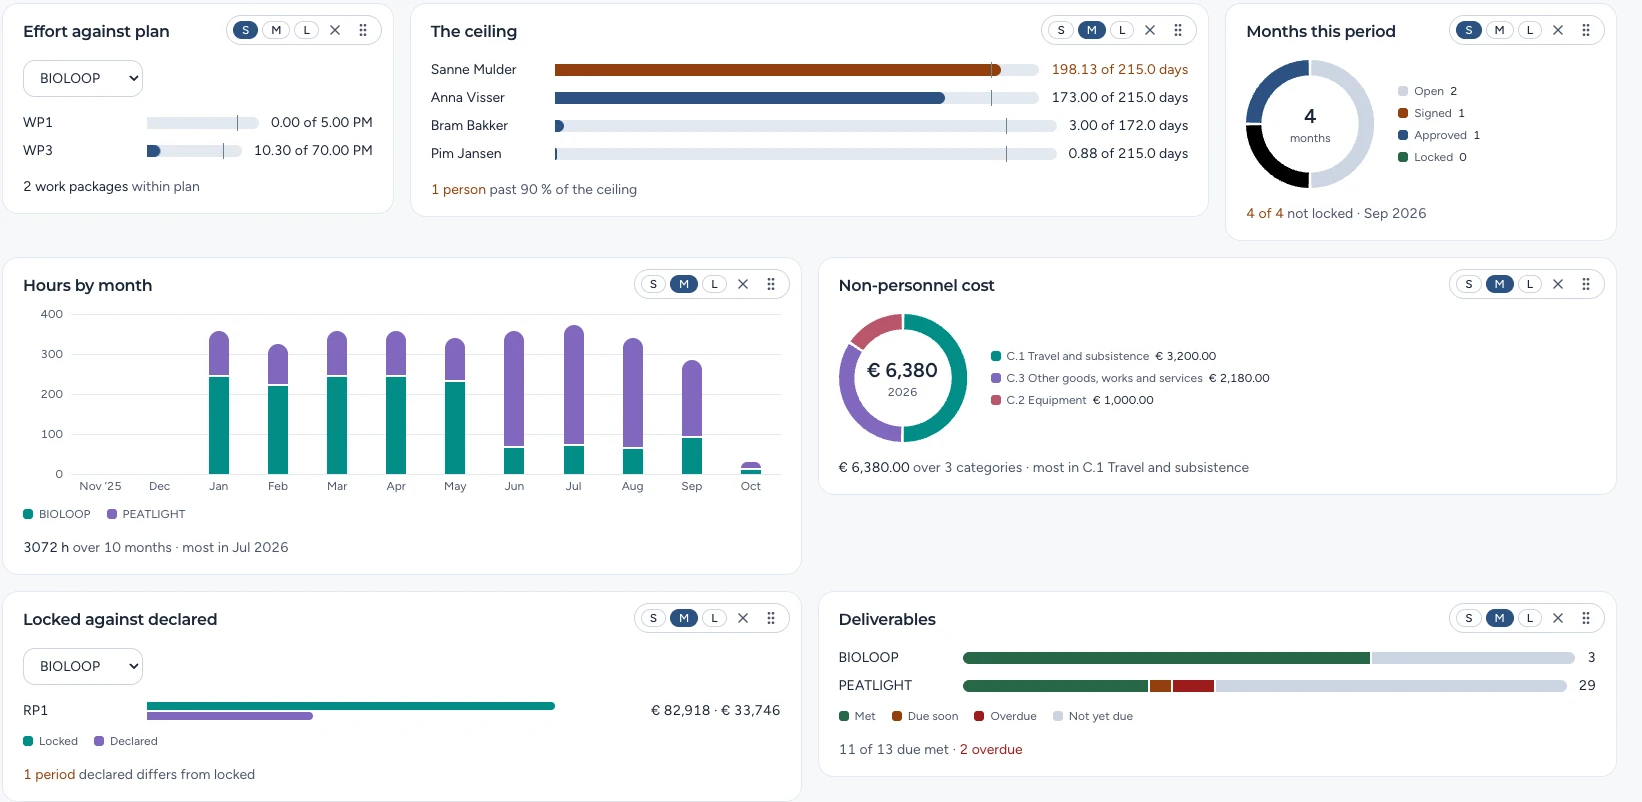
The Dashboard: effort against plan, the ceiling, months this period, hours by month, non-personnel cost, locked against declared, deliverables

How it works

  1. 1

    Pick tiles

    From what your role may see.

  2. 2

    Scope them

    A grant, a person, a year.

  3. 3

    Read the line

    Each chart says what it means.

Product

See it on your own kind of project

Half an hour, in Dutch or English, with the people who build it.

Book a demo